COVID-19 Does One Size Fit All?
By Brian WoolfSeptember 8, 2020

One set of nation-wide rules is heralded by some political leaders as the way to solve the US Covid-19 (CV) crisis. But it really is just another way of saying, One size fits all - and it does, if everyone has the same-sized feet. But we don't. Our 50 states don't have same-sized "Feet". Solutions should be matched to specifics, not generalities...
Different States. Different Shoe Sizes.
Let's compare the CV experience of our least and most populated states through Aug 25.
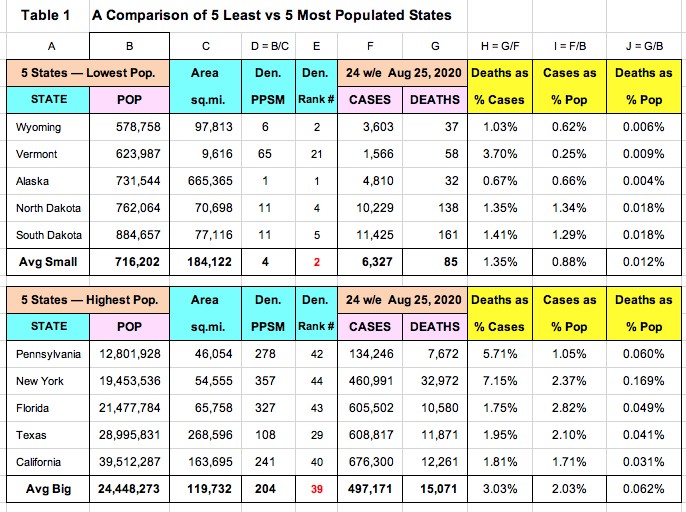
Table 1 covers two major periods in our CV history: the 16-week (Mar 10 - Jun 30) period of unknown territory-surprises, deaths (some high), and a range of responses (including many states with lockdown and some without.) The 8-week period (Jul 1 - Aug 25) that followed was all about readjustment as some early high-death states (eg, NY, NJ) saw their cases and death rates fall significantly while other early low-death states (eg, FL, TX) experienced the opposite. Combining these two periods gives us a balanced 24-week base to look for meaningful metrics.
Which Metrics Stand Out in Table 1?
1. The average population of the five most populous states is 24.4 million. That's 34 times the average population of the five least populous states (0.7 million). See Table 1, col B. (Also Table 2, row 1.)
2. Yet despite this huge difference in population the high-population states are, on average, 30% smaller in size than the small-population states (~120,000 sq miles vs ~184,000 sq miles.) See col C. (Also row 2.)
3. The Density difference (People Per Sq Mile or PPSM) is even greater; the smaller-sized, big-population states have 204 PPSM or 51x that of the 4 PPSM in the small-population states. See col D. (Also row 3.)
4. The Density of the 5 small-population states (as a group) would rank them 2nd lowest density in the nation; the Density of the 5 big-population states (as a group) would rank them 39th least dense in the nation (or the 11th most dense!) See col E. (Also row 4.)
The above four metrics are included in Table 2 with five key CV health metrics.
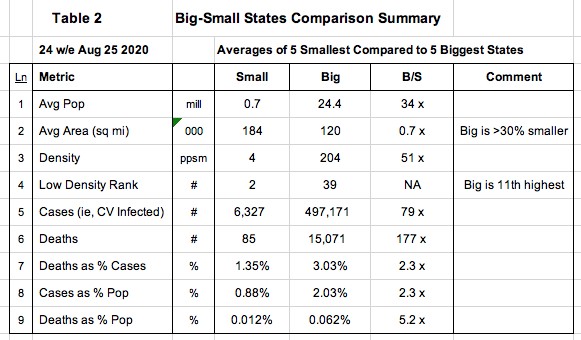
As the rows 5-6 in Table 2 show, the difference in Cases (ie, CV infections) and Deaths between the Small and Big population states is magnified further. While the Big States' average population is 34x that of Small States (row 1), its number of CV infections is 79x greater and, even worse still, 177x the number of deaths.
Using the data in rows 7-9, another way to express these differences between the Small and Big population states is since CV appeared early this year:
1. Less than 1% of the low population states were infected by the virus (yet over 2% were infected in the high population states). Row 8.
2. Of those infected in the low population states, 1.35% later died (yet over 3% died in the high population states). Row 7.
3. Which means that in the (approx.) first 6 months of the CV crisis, just over one one-hundredth of 1% of the low population states died from CV (yet just over six one-hundredth of 1% in the high population states). Row 9.
4. In other words, citizens of the high-population states died from CV at rate over 5x greater rate than those in the low-population states. Row 9.
Significance?
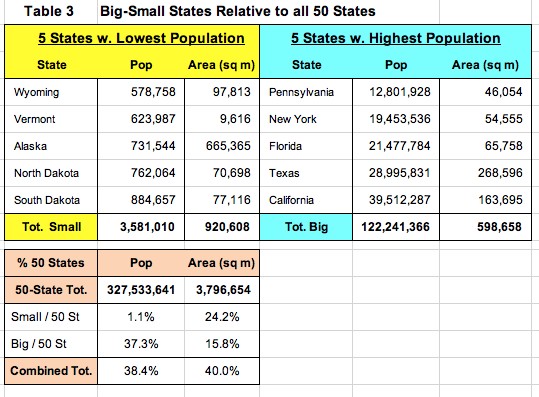
Table 3 highlights the 10 states discussed: although comprising only 20% of the states, these 10 states comprise 40% of the total area of the US and almost 40% (38.4%) of the population. It represents a significant part of the US.
The data (ex Worldometers.info) covers the approx. 6 months since the virus began. It vividly shows the wide range of health impact Covid-19 had on different states. The impact on some states was significant. On others, the opposite.
And just as a doctor prescribes one medicine for patients with a severe flu and another for those with a mild flu, so should our political leaders vary their CV prescriptions according to each state's needs. A one size prescription does not fit all states.
About the author...
Besides a full business life in retailing, and later, loyalty marketing, the other part of Brian Woolf's life has been filled with diverse interests: particularly speaking (including Toastmasters), travel (including all seven continents), and reading (including history). And he has written seven books sharing what he has learned along the journey. Ask him, two favorite trips? Antarctica and the Nile. Ask him, two favorite books? The Lessons of History (Will & Ariel Durant) and Over the Edge of the World (Laurence Bergreen). He loves learning and sharing.